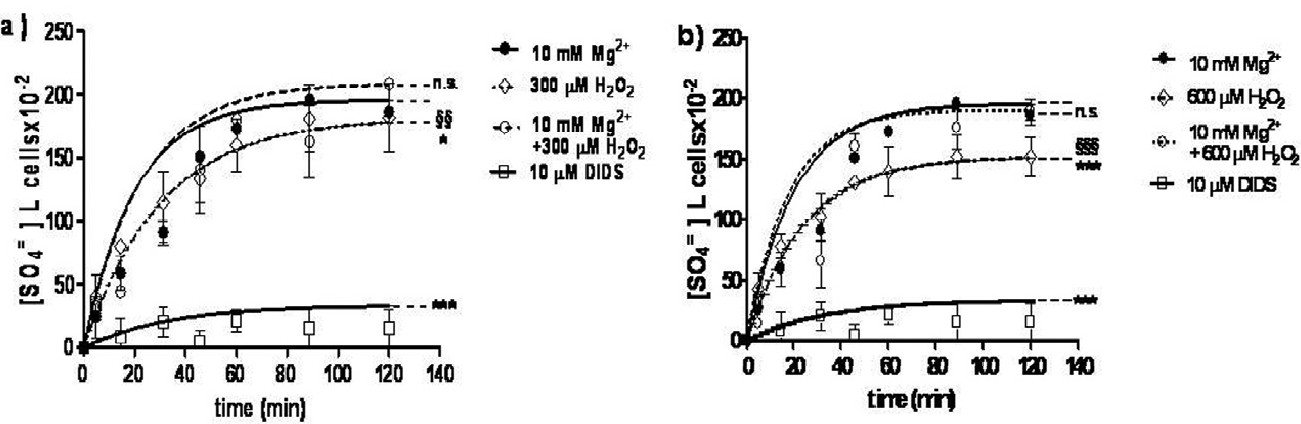
Fig. 2. Time course of SO4= uptake in human erythrocytes measured in control conditions (10 mM Mg2+) or in erythrocytes treated with300 μM H2O2 or 10 mM Mg2+ + 300 μM H2O2 (A); or with 600 μM H2O2, or 10 mM Mg2+ + 600 μM H2O2 (B) or 10 μM DIDS (A,B). Points represent the mean ± SD from at least 5 separate experiments (see Table 1), where n.s. is not significant, *p<0.05 and ***p<0.001 versus control; §§p<0.01 versus 300 μM H2O2, §§§p<0.001 versus 600 μM H2O2.